One of my favorite features in Google Ads is the ability to create unique custom columns. Not only are they easy to create, but they have saved me hours from having to segment, export and manipulate data just to uncover (or maybe not) something actionable.
Gone are the days of having to segment by conversion action, device, or network – all of these data points can be highlighted front and center with the help of custom columns. No more having to open multiple tabs to compare more than two date ranges or check the all-time performance of a specific keyword.
With custom columns, all of that is possible to show within a single column. In this comprehensive guide, we’ll explore the ins and outs of custom columns, offering insights and practical tips to help you elevate your advertising game.
Why Are Custom Columns Valuable?
Think of custom columns as custom lenses that you can place within your Google Ads account. Instead of being limited to standard metrics, you can create personalized columns that combine, filter, and transform existing data points that offer a tailored view of the account’s inner workings.
Custom columns are essentially user-defined metrics that provide a deeper level of insight into your advertising performance. By combining existing metrics in unique ways, you can create a customized view that aligns with your business goals and offers a clearer understanding of your account’s success.
Tired of manually piecing together data from different reports? Custom columns let you consolidate crucial information into a single, easily digestible view, saving you precious time and effort.
One of the best things about custom columns is that they work across Campaigns, Ad Groups, and Keywords, so you can have a better understanding of what’s actually driving performance in your account across all levels.
How To Create Custom Columns
So you may be wondering, “Gee, Al, how do I create custom columns?” Below is a step-by-step guide on how to create custom columns, how I personally like to use custom columns, and some of the best custom columns that have helped me improve overall account performance.
Create custom columns using these steps:
- Modify Columns: Click on “Columns” > “Modify columns.”
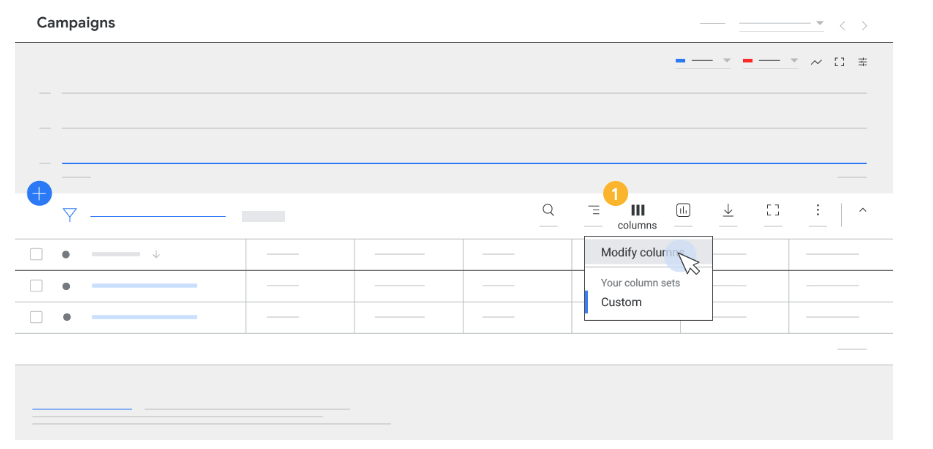
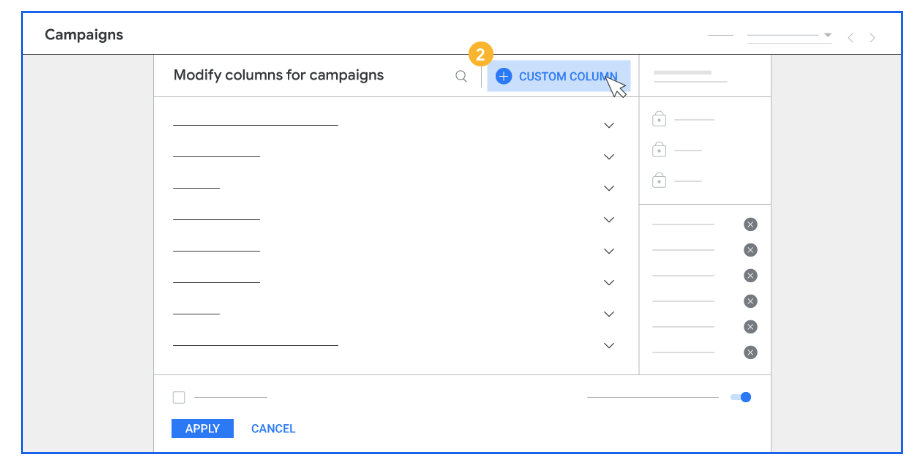
2. Add a Column: Locate and click the “+ Custom column” button.
3. Name: Assign a clear and descriptive name for easy identification (note, keep it short for a clean dashboard)
4. Description: You don’t have to, but I prefer to add a quick description for others to easily reference the metrics this custom column references. What you write here will appear when you hover over the column.
5. Data Format: Don’t overlook this one because once you save it cannot be edited. This is where you select the column format (Money, Number, Date, Percent, True/False, abc).
6. Building the Formula: This is where the magic happens. You have two options – you can use either Visual or Text Mode:
a. Visual Mode: Allows you to drag and drop metrics from the dropdowns with ease
b. Text Mode: Allows you to build a formula similar to how you would in Excel. Text mode also allows you to copy and paste the formulas in the next section 🙂
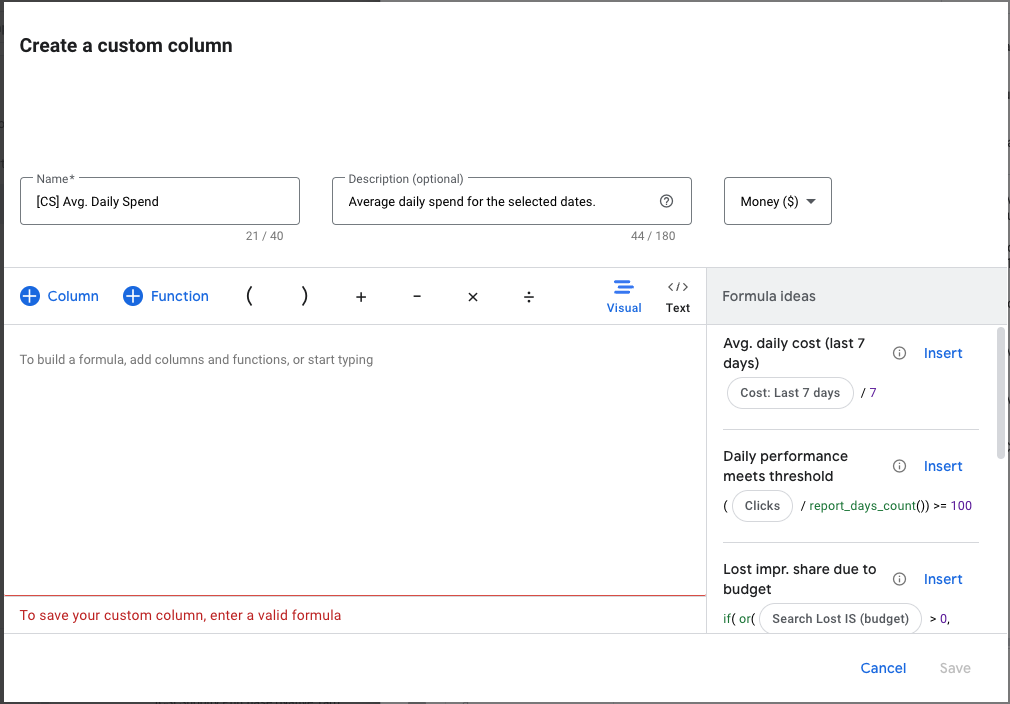
i. Here’s an example of how to create Average Daily Spend using Visual Mode.
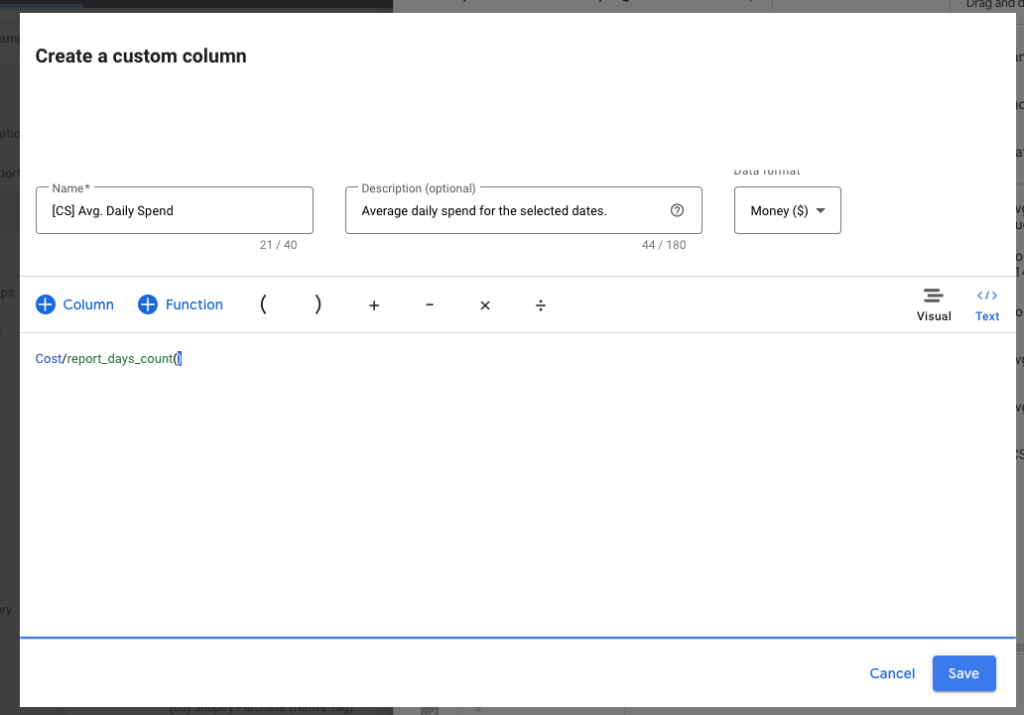
- Click + Column, then select the metric “Cost”
- Click the Divide symbol
- Click + Function, then select the function report_days_count, which pulls the number of days covered by the date range you have selected. The great thing about this function is that it is dynamic, so if you have the last 7 days selected the formula will divide by 7.
- Click Save, your custom column is now available to be added to your dashboard as well as being able to be used in the line graph on the campaigns tab.
ii. Pro Tip: When creating a custom column from scratch, Visual Mode is what I prefer. However, I mostly find myself using Text Mode by copying and pasting the formula from a resource like Linkedin or The Custom Column Library.
Tips for Using Custom Columns
Now that we have an understanding of how to create custom columns, let’s talk about some tips for using custom columns, as well as some categories of custom columns you can create. Hopefully, this section will jumpstart some custom column ideas that you can deploy in your account. The following tips will help you make the most of using custom columns in your process.
1. Start Simple
If you’re new to custom columns, start with basic metrics and formulas. As you become more comfortable, you can gradually introduce more complex custom columns to refine your analysis.
2. Regularly Review and Update
Regularly review your custom columns to ensure they remain relevant and aligned with your campaign goals. Update formulas or metrics as needed to reflect shifts in strategy or market conditions.
One common update is migrating a Conversion column from using “Conversions” to “All Conversions” as conversion actions change from Primary to Secondary. (Pro Tip: When creating Conversion custom columns, use “All Conversions” for both Primary and Secondary Conversion actions)
3. Document Your Custom Columns
Maintain documentation for each custom column you create. Include details such as the purpose of the metric, the formula used, and any specific conditions or parameters.
There are two benefits to this—first, if you ever transition off the account, whoever is replacing you now has a reference for the custom columns you have created. Second, the actual formulas you’re using can be copied and pasted into other accounts. So if you work at a digital marketing agency, everyone can benefit from your knowledge.
4. Combine Custom Columns with Automated Rules
Google Ads offers automated rules that allow you to set predefined conditions and actions based on your campaign’s performance. You can combine custom columns with automated rules to create a dynamic and automated advertising strategy. For example, if you have multiple primary conversion actions and want to increase the budget for only a specific one of those primary conversion actions.
Bonus: If you work for an agency, creating custom columns on your MCC dashboard is extremely helpful. We’ve been using them here at collystring, and it’s the first and last thing we look at each day.
Custom Column Categories
Understanding the different categories for custom columns will help you understand all your options and maximize their usefulness. The following are the most common custom column categories:
- Performance Segmentation: Custom columns enable you to segment your performance data based on specific criteria. For example, you can create a custom column that calculates the cost per conversion for each device type (desktop, mobile, tablet). This allows you to identify which devices are driving the performance.
- Conversion Funnel Analysis: For businesses with a complex conversion funnel, custom columns can allow you to see which campaigns are driving which conversion action without having to segment. Additionally, you can create efficiency metrics (CPA and/or ROAS) using your newly created conversion column.
- Time Analysis: Understanding when your audience is most active can significantly impact your campaign’s success. Use custom columns to break down performance data by hour or day of the week. Identify peak times for clicks or conversions and adjust your bidding or ad scheduling accordingly.
- Time Segment Trends: You can create a custom column to show you a specific metric over a specific date range. For example, you can have a column that shows you the ROAS from the last 14 days, or the Cost from the L30 days. The benefit of doing this is that you can easily and quickly see how a Campaign, Ad Group, or Keyword is trending, e.g. if your date range is set to last 30 days and has a 4 ROAS, but your L14 ROAS column shows a 2, you know to review performance over the last 14 days to see where the drop off is coming from.
Useful Custom Columns with Formulas
What are my favorite custom columns? Glad you asked. In this section, I’ll share some of my favorite custom columns along with their formulas so you can copy and paste them into your account (using text mode!). Note that conversions and conversions (by conv. time) are interchangeable within the formulas, so use your preference.
Valuable Custom Column Examples
| Name | Description | Formula | Format |
| Cost / Conv: Last 90 Days (or any duration, I typically create a 7, 14, 90) |
Static Cost per conversions over the last 90 days | Cost_per_conv.between_dates(today.shift(0, 0, -90), yesterday) | Money |
| Conv. Value / Cost: Last 7 Days (or any duration) |
Static return on ad spend over the last 7 days. | Conversion_value.date_range(last_7_days) / Cost.date_range(last_7_days) | Number |
| Average Daily Spend | Average spend for the number of days you have selected | Cost / report_days_count() | Money |
| Mobile Conversions | Conversions on mobile devices | Conversions_by_conv_time.device(mobile) / Clicks.device(mobile) | Number |
| Desktop Conversions | Conversions on desktops | Conversions_by_conv_time.device(desktop) / Clicks.device(desktop) | Number |
| Last Month’s Spend | Static Spend from last month | Cost.date_range(last_month) | Money |
| Last Month’s Conversions | Static Conversions from last month | Conversions_by_conv_time.date_range(last_month) | Number |
| Last Month’s Conversion Value | Static Conversion Value from last month | Conversion_value_by_conv_time.date_range(last_month) | Money |
| Expected Conversions this Month | Realized Conversion plus the average Conversions of the last 7 days multiplied by remaining days in the month | Conversions_by_conv_time.between_dates(month_start, yesterday) + (Conversions_by_conv_time.date_range(last_7_days) / 7) * (day(offset_days(offset_months(month_start(), 1), -1)) – day(today())) | Number |
| Expected Conversion Value this Month | Realized Conversion Value plus the average Conversion Value of the last 7 days multiplied by remaining days in the month | Conversion_value_by_conv_time.between_dates(month_start, yesterday) + (Conversion_value_by_conv_time.date_range(last_7_days) / 7) * (day(offset_days(offset_months(month_start(), 1), -1)) – day(today())) | Money |
| Percentage Spend on Search Partners | Percent of spend that has gone to search partners (which you should probably pause 🙂) | Cost.network(partners) / Cost | Percent |
| Mobile Traffic | Number of clicks from mobile devices | Clicks.device(mobile) | Number |
Key Takeaways
In conclusion, using custom columns has been a time saver for me. Rather than manually piecing together data from different exports, custom columns have allowed me to consolidate crucial information into a single, easily digestible view.
In the competitive landscape of Google Ads, staying ahead requires strategic thinking and a data-driven approach. Custom columns within Google Ads allow for just that while also empowering you to think outside the box and create unique custom columns specific to your account.
I hope that you find this blog useful, and please share what other custom columns you use that have helped your daily workflow or helped to improve account performance.